


Pre and post Hurricane Sandy damaged trees in and around New York City. Visualisation by dataappeal.com
Big data and its hand maiden data visualisation are two synergetic tools that will help shape the cities of tomorrow. Why?
The ability to use hard information to gain crucial insights into our evolving environment is a game changer. Adding ways to make all that information understandable to the rest of us is not only icing on the cake, it is essential. If anything the last few post-financial meltdown years have taught us is that if science can be ignored for the sake of the general economy it will be. Information like that illustrated above is difficult to ignore.
It is access to reliable, coherent information about the world around us that will make decision making easier in the coming years. Policy makers will be able to access up-to-date resources that earlier generations of politicians and bureaucrats could only dream of having. The public too will have access to this data. Take a look at these recently released satellite photos as an example of open data’s power to inform.
Here is a night view of North Dakota. Notice that in one of America’s least populated regions the oil and gas drilling industry is adding its own grid to the landscape.
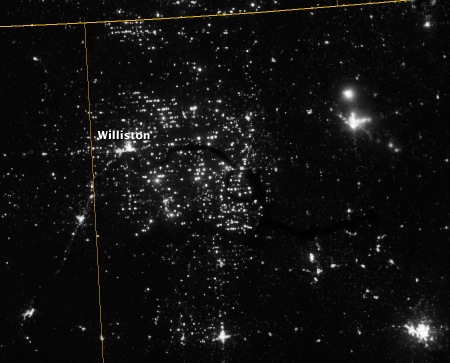
The ability to capture this image and its related data was made possible by the launch of a new satellite:
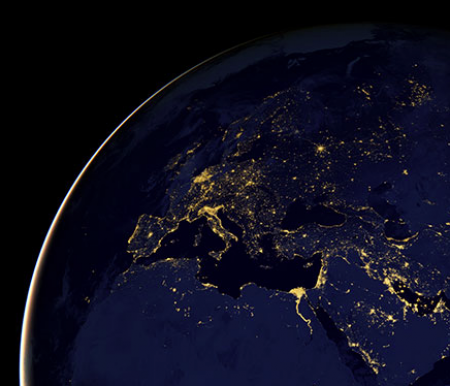
The Suomi National Polar-orbiting Partnership (NPP) satellite — launched in October 2011 by NASA, the National Oceanic and Atmospheric Administration (NOAA), and the Department of Defence — carries a low-light sensor that can distinguish night lights with six times better spatial resolution and 250 times better resolution of lighting levels (dynamic range) than before. Also, because Suomi NPP is a civilian science satellite, data is available to scientists within minutes to hours of acquisition.
The Visible Infrared Imaging Radiometer Suite (VIIRS) on Suomi NPP can observe dim light down to the scale of an isolated highway lamp or fishing boat. It can even detect faint, nocturnal atmospheric light — known as airglow — and observe clouds lit by it. Through the use of its “day-night band,” VIIRS can make the first quantitative measurements of light emissions and reflections, distinguishing the intensity and the sources of night light. The sum of these measurements gives us a global view of the human footprint on the Earth.
Note that Canadian satellite pioneer Dr. John MacDonald has spent a long career investigating the use of space-based technology to gain insights into the natural world. We covered his talk at the Globe2012 Conference. We will end this discussion with an excerpt from that posting:
Don’t believe in global warming caused by human activity? Your loss in the long term argued McDonald. Dr. McDonald drew on his experience in satellite imaging systems and the data they offer to provide proof that we are driving climate change and denying it is not a rational option. Building an economy on oil rather than value-added renewable energy will not work in the long term.
“City lights provide a fairly straightforward means to map urban versus rural areas, and to show where major population centers are and where they are not,” says William Stefanov of the International Space Station program.


