

Estimated US energy use in 2008 ~ 99.2 Quads (Lawrence Livermore Nation Lab.) FYI, one quad equals the energy produced by 8,007,000,000 Gallons (US) of gasoline. One gallon of gasoline equals 114000 BTU.
How can relatively small (and easily achievable) improvements in building technology save the world? Our last entry on the Vectorbloc modular building system explains how improving the way we build saves money, time, and energy. In this posting we illustrate how companies devoted to the “E” in a MESH City–that is Efficiency–will profoundly benefit global cities’ energy bottom line (as the following graph from the Rocky Mountain Institute suggests with US-only data).
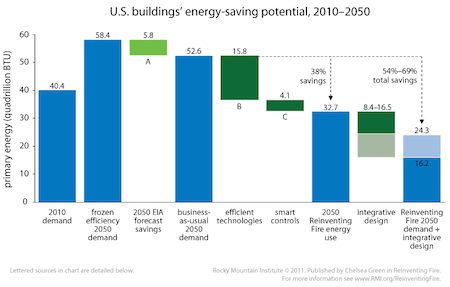
US buildings’ energy-saving potential to 2050 (Rocky Mountain Institute). Equivalent gasoline use reductions would be in the order of ±80 billion gallons saved (MESH Cities estimate)
A key driver in designing the energy-efficient MESH Cities of tomorrow, today is the use of Big Data to understand energy-reducing opportunities on the massive scale needed to change the status quo. How is that possible? Having access to raw government data resources gives nimble companies using statistical analysis the opportunity to find market-disrupting inflection points.
Recently our founder, Robert Ouellette, participated in a Schneider hosted conference in Calgary. His discussion with company leaders centred on the potential of intelligent, resilient cities. While there, however, he took in a seminar on SE’s recently deployed energy audit system. Basically a SaaS offering, what was compelling about the service was how it simplified the auditing process to the point where building managers can now easily and cheaply find the low hanging energy-savings fruit, as it were, that will save them tens of thousands of dollars in energy costs per year.
How cheap is SE’s audit? Under $1,000.
As a former researcher and developer of online energy audit systems, Ouellette knew that in SE’s model he was seeing an example of disruptive market innovation that changes the competitive landscape–to the benefit of cities everywhere. But how did SE do it? How is it possible to take a few simple energy-consumption metrics and with them design a cheap energy management solution that rivals those costing ten or more times the price?
Big Data, that’s how.
Now, we are making some educated guesses here, and the truth is any engineer who sees the SE presentation of their “Remote Energy Assessment” service will quickly figure out the modelling algorithm they base their system on.
For example, the US Government publishes the “Building Data Book.” Here is how they describe it:
The Data Book includes statistics on residential and commercial building energy consumption. Data tables contain statistics related to construction, building technologies, energy consumption, and building characteristics.
The Building Technologies Program within the U.S. Department of Energy’s Office of Energy Efficiency and Renewable Energy developed this resource to provide a current and accurate set of comprehensive buildings- and energy-related data. The Data Book is an evolving document and is updated periodically.
With this US Government data in hand, a smart energy-solutions provider would be able to create some accurate modelling algorithms to build a SaaS solution on. The real benefit of SE’s approach is that they follow it up with a family of energy management devices that together will improve building energy efficiency. Doing that can also make buildings more pleasant to work in as well.
This is one example of how in MESHed Cities information management along with sound analysis are making our world more sustainable.


")


