In MESH Cities information drives local economies. Deriving that information, disseminating it, and finally, understanding it are the new engines of economic and social prosperity.
Some regions manage the so-called information economy better than others. Not surprisingly, those with information management skill manifest that skill through a cascade of life-improving initiatives that span the public and private sectors. The regions that don’t . . . Perhaps the greatest challenge facing emerging MESH City economies is the complexity of raw data.
Unless one is highly skilled in the subject matter being studied, 500 pages of data is as indecipherable as the cypher of an Enigma Machine. Useless. We argue that many of the questionable political decisions being made by the public in parts of North America recently are less about the perceived ignorance of the public and more about the inability to provide people with information they can actually understand. Enter the artist.
Artist and scientist Stephen Von Worley’s data visualization research offers “a journal of interesting information imagery and news from around the world; and a place where you can spend a few minutes, have a laugh or two, and discover something new.” More importantly, Von Worley is one of a new breed of people working to make complex information understandable to the rest of us. Here is one of his projects. 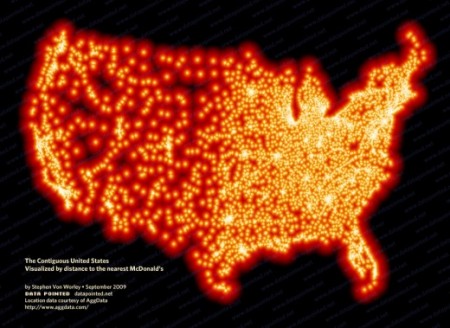
The number of McDonald restaurants in the US.
Let’s contrast this to the number of public libraries in the US.
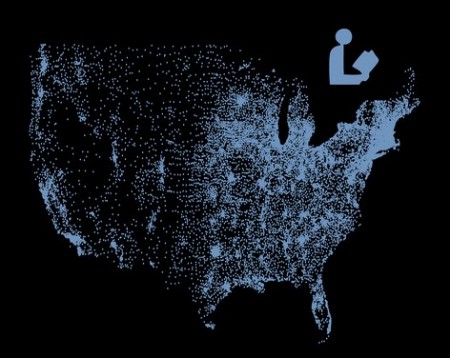
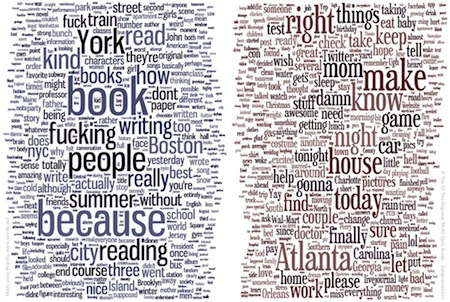
The eating economy versus the information economy. Libraries still hold about a 15% edge. Thankfully. Another focus of Von Worley’s digital lens is the north-south cultural divide in the US. Using blog posting thematic analysis he produced this topic map illustrating the social concerns of those divided by the Mason Dixon line. Information is power. 